I have been building quite a number of dashboards from a professional front. Obviously none can be shared on a public domain. So finally I decided to start showcasing some of my learnings on data make over and transformations through this blog. And what better way can it be to start with Andy's MakeOverMonday challenge especially now that I am working for one of the top Online Travel Agents in the US. I am astonished how much business is going through Web and rapidly is OTA taking over Travel agents.
I acknowledged in my earlier post that I tried to simulate the best makeover to understand and learn from those Viz Masters. And this is no different. Andy's and Andy's makeovers are in the original link here. So here is the first cut of my version of the replication.
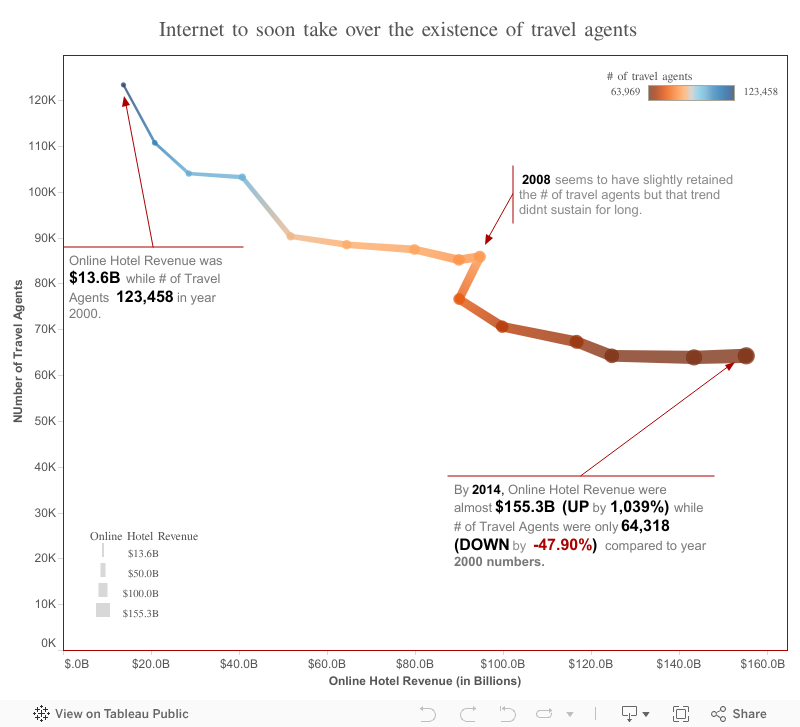
- Made use of color to show the drop in the number of travel agents and size to show how the Online revenue is growing over a period of time.
- Got a better understanding how to show the correlations between two entities - the drop in travel agents and the rise in the online bookings - through a connected scatter plot.
- For the first time, tried to use the PATH pill and it makes complete sense of its existence. :)
Here is the link to the my Tableau Public profile here.
Happy Data Make Over.
No comments:
Post a Comment